Live Capture
hdds_viewer supports real-time DDS traffic capture via the HDDS Telemetry TCP protocol, enabling live monitoring and recording of DDS networks.
Overview
Live capture connects to an HDDS-enabled DDS participant and streams messages in real-time. This enables:
- Real-time traffic monitoring
- Live anomaly detection with ML
- On-the-fly QoS analysis
- Recording to
.hddscapfiles
Connection Methods
HDDS Telemetry TCP
Connect to an HDDS participant's telemetry endpoint:
hdds-viewer --live --host 192.168.1.100 --port 7410Default port: 7410
Local Domain
Monitor a local DDS domain:
hdds-viewer --domain 0This creates a local participant that discovers and monitors traffic.
GUI Mode
Start Live Capture
1. Open hdds_viewer
2. File > Live Capture or press Ctrl+L
3. Configure connection:
- Host: Target IP or hostname
- Port: Telemetry port (default 7410)
- Domain: DDS domain ID (0-232)
4. Click Connect
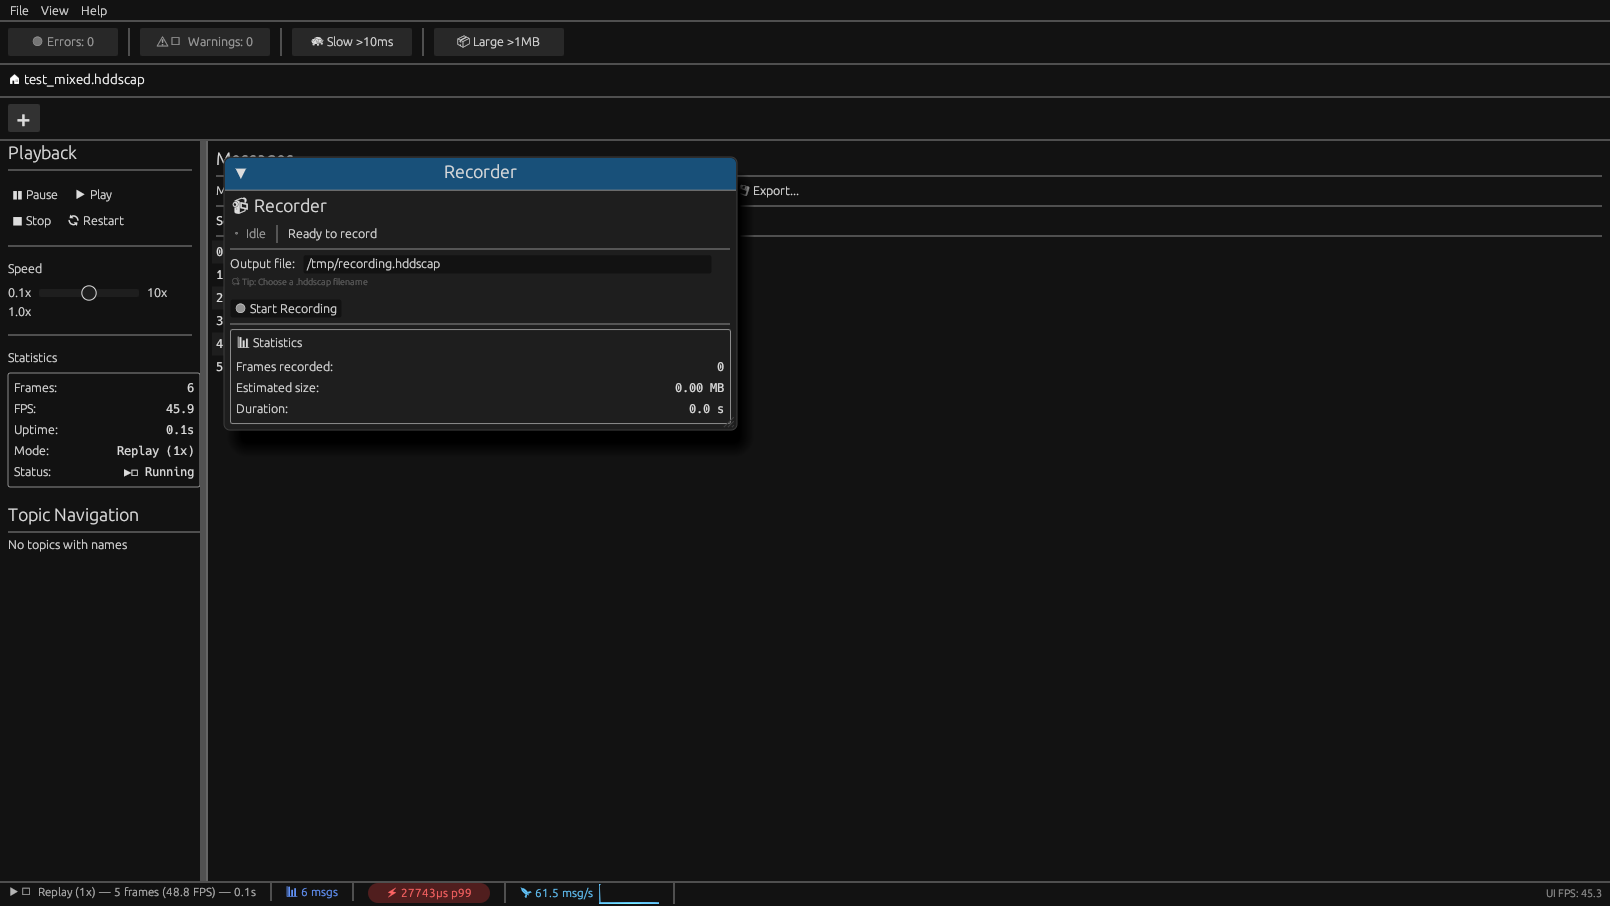
Recorder Panel
Enable recording during live capture:
1. Open View > Recorder panel
2. Set output path (e.g., capture.hddscap)
3. Click Start Recording
4. Click Stop Recording when done
Recording statistics shown:
- Frames captured
- File size
- Duration
- Throughput (msg/s, MB/s)
CLI Mode
Monitor and Display
# Monitor domain 0, display to terminal
hdds-viewer --domain 0 --format text

JSON output for piping
hdds-viewer --domain 0 --format json | jq '.topic'

Statistics only
hdds-viewer --domain 0 --stats
Record to File
# Record with compression
hdds-viewer --domain 0 --record capture.hddscap --compress

Record with time limit
hdds-viewer --domain 0 --record capture.hddscap --duration 5m

Record with size limit
hdds-viewer --domain 0 --record capture.hddscap --max-size 1GB
Live Analysis
# Live ML detection
hdds-viewer --domain 0 --ml-detect

Live QoS monitoring
hdds-viewer --domain 0 --qos-alerts

Combined
hdds-viewer --domain 0 --ml-detect --qos-alerts --format json
Filtering
Topic Filters
# Single topic
hdds-viewer --domain 0 --topic SensorTopic

Regex pattern
hdds-viewer --domain 0 --topic-pattern "Sensor."

Multiple topics
hdds-viewer --domain 0 --topics SensorTopic,CommandTopic
Type Filters
# Filter by type name
hdds-viewer --domain 0 --type sensors::SensorData
Content Filters
# Filter by payload content (requires type info)
hdds-viewer --domain 0 --filter "data.value > 100"
Configuration
Telemetry Settings
# ~/.config/hdds-viewer/config.toml

[live]
default_host = "localhost"
default_port = 7410
default_domain = 0
auto_reconnect = true
reconnect_delay_ms = 1000

[capture]
default_path = "~/captures/"
compress = true
max_size = "10GB"
rotate = true
rotate_count = 5
Buffer Configuration
[performance]
ring_buffer_size = 100000  # Message buffer
frame_batch_size = 100     # Frames per UI update
history_depth = 10000      # Frame table limit
Protocol: HDDS Telemetry TCP
Connection Flow
Client                              Server (HDDS Participant)
   |                                     |
   |  ---- TCP Connect (port 7410) ---->|
   |                                     |
   |  <---- HELLO (version, caps) ------|
   |                                     |
   |  ---- SUBSCRIBE (topics, QoS) ---->|
   |                                     |
   |  <---- FRAME (topic, payload) -----|
   |  <---- FRAME (topic, payload) -----|
   |  ...                               |
   |                                     |
   |  ---- UNSUBSCRIBE ---------------->|
   |                                     |
   |  ---- CLOSE ---------------------->|
Message Format
| Field | Size | Description |
| magic | 4 | HDTM (0x4844544D) |
|---|---|---|
| version | 2 | Protocol version |
| msg_type | 2 | HELLO, FRAME, etc. |
| length | 4 | Payload length |
| payload | var | Message-specific |
Frame Message
| Field | Size | Description |
| timestamp_ns | 8 | Nanoseconds since epoch |
|---|---|---|
| topic_id | 2 | Topic identifier |
| type_id | 2 | Type identifier |
| qos_hash | 4 | QoS profile hash |
| flags | 4 | Key, dispose, etc. |
| payload_len | 4 | CDR payload length |
| payload | var | CDR2 encoded data |
Performance
Throughput Limits
| Mode | Throughput |
| GUI (with rendering) | ~100k msg/s |
|---|---|
| CLI (text output) | ~500k msg/s |
| CLI (recording only) | ~1M msg/s |
| Headless (no output) | ~5M msg/s |
Adaptive Sampling
At high message rates, adaptive sampling kicks in:
| Rate | Behavior |
| < 30k msg/s | All frames processed |
|---|---|
| 30k-60k msg/s | 1/2 frames to UI |
| 60k-100k msg/s | 1/4 frames to UI |
| > 100k msg/s | 1/10 frames to UI |
Recording always captures all frames regardless of UI sampling.
Enabling HDDS Telemetry
In Your Application
use hdds::prelude::;

let participant = DomainParticipant::builder()
    .domain_id(0)
    .with_telemetry(TelemetryConfig {
        enabled: true,
        port: 7410,
        max_connections: 5,
    })
    .build()?;
Via Environment
HDDS_TELEMETRY_ENABLED=1 HDDS_TELEMETRY_PORT=7410 ./my_dds_appVia Config File
# hdds.toml
[telemetry]
enabled = true
port = 7410
max_connections = 5
topics = ""  # Or specific list
Troubleshooting
Connection Refused
Error: Connection refused (127.0.0.1:7410)- Target application not running
- Telemetry not enabled
- Firewall blocking port
# Verify port is listening
netstat -tlnp | grep 7410

Check firewall
sudo ufw allow 7410/tcp
No Messages Received
Connected to 192.168.1.100:7410
Waiting for messages... (0 received)
- No publishers on domain
- Topic filter too restrictive
- QoS mismatch
# Monitor all topics
hdds-viewer --domain 0 --topic-pattern "."

Check discovery
hdds-viewer --domain 0 --discovery-only
High CPU Usage
Warning: High message rate (>100k msg/s), enabling adaptive sampling- Use CLI mode instead of GUI for high rates
- Enable recording and analyze offline
- Filter specific topics
# Record only, no display
hdds-viewer --domain 0 --record capture.hddscap --quiet
Security
TLS Support (Enterprise)
hdds-viewer --live --host secure.example.com --port 7410 --tls \
  --cert client.crt --key client.key --ca ca.crt
Authentication
[live.auth]
method = "token"
token_env = "HDDS_VIEWER_TOKEN"
Best Practices
1. Use recording for analysis - Live ML detection adds latency; record first, analyze later for best results
2. Filter aggressively - On busy networks, filter to specific topics of interest
3. Monitor resource usage - Watch memory with --stats flag on long captures
4. Use compression - Always enable --compress for recording to save disk space
5. Air-gapped networks - Use --no-network flag to ensure no external connections